How I Built an ICP Scoring Engine for Supply Chain Risk
Most GTM teams target accounts by industry and revenue. When you're selling a risk product to mid-market manufacturers, that misses the point. I built a scoring engine that factors in disruption exposure, financial vulnerability, and buying readiness to turn 5,000 accounts into 200 worth calling.
How I Built an ICP Scoring Engine for Supply Chain Risk
In early 2025, U.S. tariffs on Chinese imports hit 145%. China retaliated with 84% duties going the other direction. The WTO warned that bilateral trade between the two countries could fall by up to 80%. Large OEMs had the pricing power and supply chain flexibility to absorb the shock. Mid-market manufacturers, the $200M to $2B companies running 5 to 50 critical suppliers, got squeezed hardest. As Manufacturing Dive reported, tariff uncertainty hit small and mid-sized firms disproportionately, especially those in labor-intensive functions like metal fabrication and precision machining.
This was the latest version of a recurring problem. A year earlier, Houthi attacks in the Red Sea had diverted over $80 billion in cargo, spiking container rates to $7,000–$8,200 per container and adding weeks to lead times from Asia. Before that, semiconductor shortages. Before that, port congestion. Before that, a global pandemic.
The pattern is relentless. And yet most companies selling supply chain risk solutions still target accounts the same way they target everything else: firmographic filters, industry tags, maybe a revenue band. None of which tells you whether a particular manufacturer is actually exposed to disruption, financially vulnerable to it, or ready to buy a solution.
I wanted to build a scoring model that could factor in the actual risk posture of an account, the financial damage a disruption would cause, and whether they had the budget and operational maturity to do something about it. So I built SentinelChain.
SentinelChain
No, don’t run a Google search in the next tab or ask your favorite LLM if there’s a new company building cool stuff. It’s fictional, and the data is synthetic. It just mirrors the economics of real mid-market manufacturing portfolios. The product concept: score a universe of manufacturers on how exposed they are to supply chain disruption, how much it would cost them financially, and whether they’re in a position to buy software that helps them get ahead of it. Then rank them, segment them into tiers, and hand the output to a GTM team that knows exactly who to call and what to say.
The target buyer here is a VP of Operations or COO at a company doing $200M to $2B in revenue with a global supplier footprint and margins thin enough that one bad quarter from one bad supplier changes the year. If this sounds like you, maybe we should talk. But the real point of this project was the targeting system. How do you figure out which of these companies to talk to first.
How Most Teams Do ICP Scoring
The usual approach: marketing pulls a list from ZoomInfo or a similar platform, filters by industry and revenue, maybe layers in some intent data, and hands it to sales. The SDR team works it top to bottom with some light prioritization by company size.
This works fine when your product is horizontal, when any mid-market company in your target vertical is roughly as good a fit as any other. When you’re selling a risk product, the quality of the account depends on the specific risk posture of that account, and firmographic filters simply can’t model that. A $500M electronics manufacturer with 60% of inputs sourced from China and a single-supplier dependency for a critical component is a fundamentally different prospect than a $500M electronics manufacturer sourcing domestically with diversified suppliers. Same revenue band, completely different risk exposure. Intent data helps at the margins but only tells you someone is looking, not whether the pain underneath the search is structural or situational.
So I built a scoring engine that could.
Three Dimensions of Account Quality
The ICP scoring framework breaks the targeting question into three parts, each answering something different:
Need Score (0–40): How exposed are they?
This measures structural vulnerability to supply chain disruption. The variables that drive it:
- Import exposure: what percentage of inputs are imported, and from where
- China concentration: specific geographic risk tied to the single largest tariff-sensitive corridor
- Supplier concentration: whether the account has a dangerous single-supplier dependency
- Country risk: composite score from emerging market and high-risk geography exposure
- Lead-time variability: how volatile their inbound logistics are
- Commodity input volatility: how sensitive their input costs are to market swings
A manufacturer sourcing 60% of inputs internationally with heavy China exposure scores very differently from one sourcing 20% domestically. The Need Score captures that.
Impact Score (0–30): How much would disruption cost them?
Exposure alone doesn’t tell the full story. A company can be highly exposed and financially resilient, with enough cash reserves, wide margins, and diversified operations to absorb a disruption event without it showing up badly in the quarter. The Impact Score measures the other side of that: financial fragility.
- Operating margin (inverted, thinner margins mean higher impact)
- Gross margin (inverted)
- Working capital ratio (inverted, less liquidity means less buffer)
- Revenue scale: larger revenue means larger absolute dollar exposure
- Multi-site operations: more sites means more surface area for disruption
This is where the economic argument gets sharp. A manufacturer running 8% operating margins on an $800M revenue base has roughly $64M in operating income for the year. A two-week production shutdown from a single supplier failure won’t just cost the direct output value; it compresses the margin for the quarter and often well into the next one, depending on the recovery timeline.
Ability Score (0–30): Can they actually buy?
Need and impact tell you the account has a problem worth solving. Ability tells you they’re positioned to act on it. Budget, sophistication, organizational readiness to purchase and implement a solution:
- Revenue band: can they afford enterprise software
- Employee count: proxy for organizational scale
- Public company flag: public companies face higher compliance and governance requirements that accelerate procurement for risk tools
- ERP maturity: proxy for operational infrastructure readiness
- Revenue growth rate: growing companies invest, contracting ones cut
The composite score: ICP Total = Need + Impact + Ability, on a 0–100 scale.
Why Correlation Design Matters More Than Most People Think
I generated 5,000 synthetic accounts for this exercise. The generation was deliberate. Every variable is correlated with related variables in ways that mirror real economic relationships.
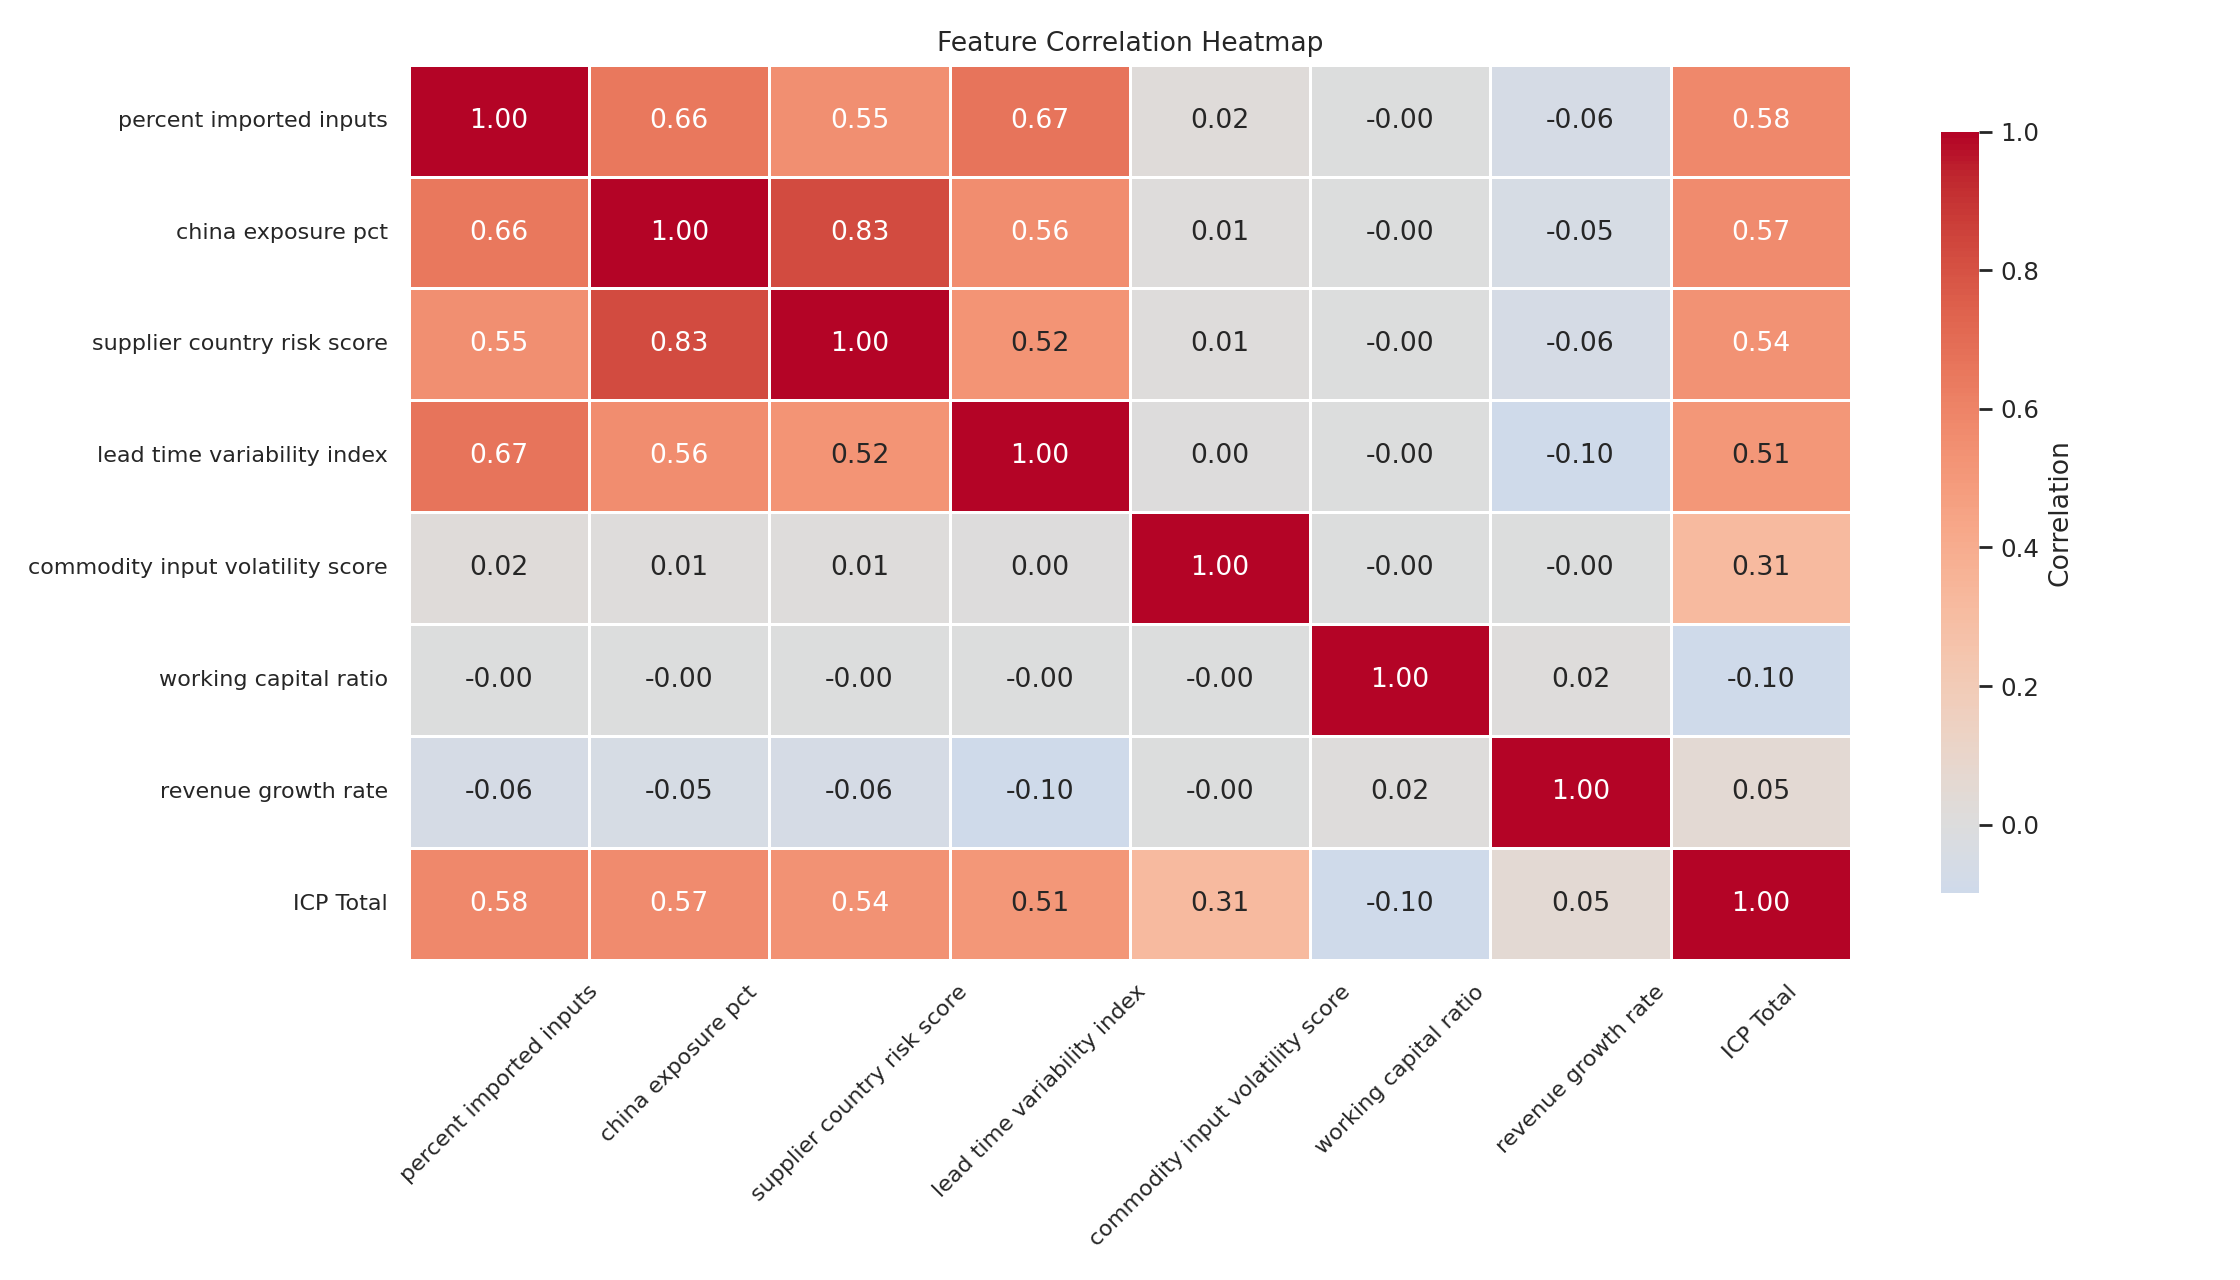
Import exposure drives lead-time variability. A company importing 60% of inputs will have more volatile lead times than one sourcing 20% domestically. The model encodes that: lead_time_variability = 0.5 × percent_imported_inputs + 0.3 × supplier_country_risk + noise. China exposure drives country risk, and emerging market exposure is positively correlated with it because companies concentrated in China tend to have broader emerging market exposure too. Commodity volatility drives margin pressure. Companies in chemicals and automotive components face structurally higher input cost volatility, which shows up as margin decline flags. Working capital inversely correlates with leverage. More debt, less liquidity buffer.
The reason this matters is straightforward: if you generate synthetic data naively, each variable sampled independently, the resulting accounts don’t behave like real companies. A manufacturer can’t simultaneously have 60% imported inputs, zero country risk, and perfectly stable lead times. That combination doesn’t exist in the real world and it shouldn’t exist in the model. The correlation structure ensures the data is economically coherent, which means the scoring on top of it actually discriminates between accounts in a realistic way.
The correlation heatmap from the output confirms this. The import exposure to country risk to lead-time variability chain shows correlations in the 0.55 to 0.83 range. Exactly where you’d expect them.
What the Scoring Output Actually Looks Like
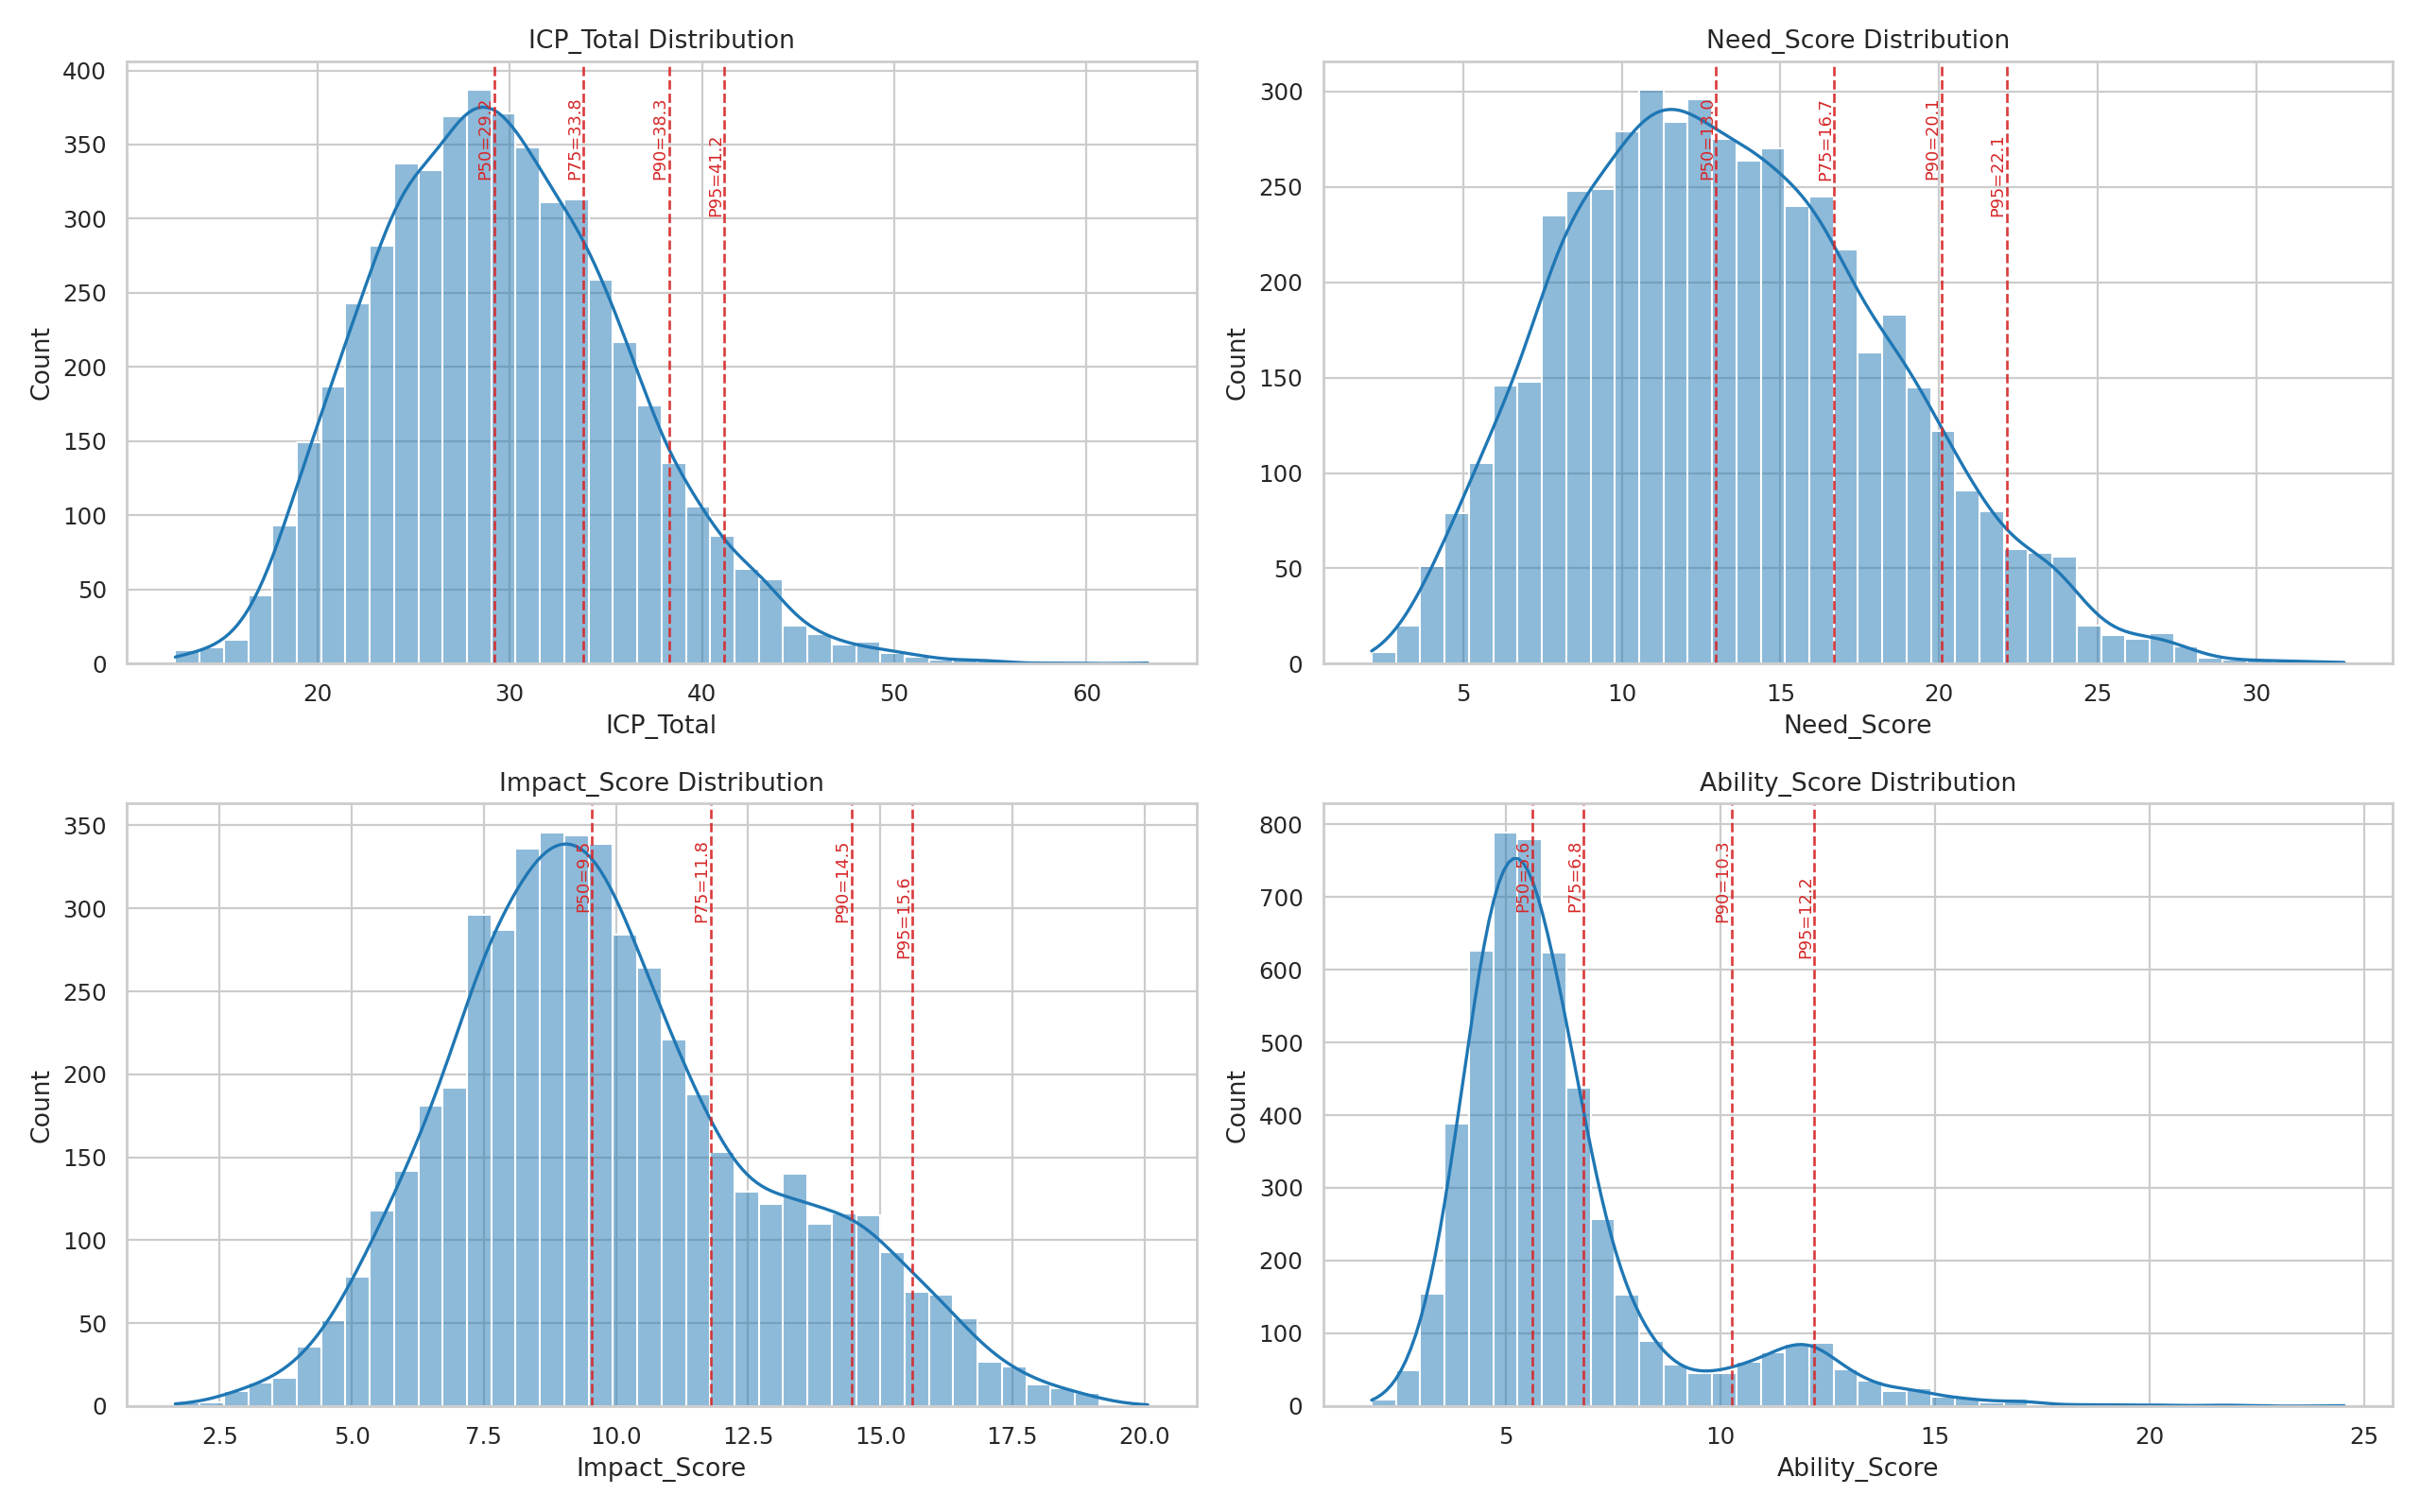
Running the engine against 5,000 accounts produces a full scored dataset. The score distributions show the kind of variance you want from a useful scoring model:
A few things to notice:
- ICP Total has a roughly normal distribution centered around 30, with a meaningful right tail extending past 50. That tail is where the high-priority targets live.
- Need Score shows a right skew. Most companies have moderate exposure, but there’s a substantial cohort of highly exposed accounts.
- Impact Score is the tightest distribution. Financial fragility is more normally distributed than exposure.
- Ability Score is sharply peaked. Most mid-market companies in this universe cluster in a similar range of organizational readiness.
The engine exports the top 200 accounts (configurable) as a JSON payload ready for CRM ingestion. A 96% reduction in targeting surface, from 5,000 accounts to 200, with every remaining account scored, ranked, and annotated with its top 5 risk drivers.
From Scores to Segments to GTM Motions
Scores are useless if they don’t map to action. The system generates prioritization tiers based on score thresholds derived from percentile breakpoints in the output distribution (the top ~5%, the next ~15%, the next ~30%, and everything below):
| Tier | ICP Threshold | Motion | Rationale |
|---|---|---|---|
| Tier 1 | ≥ 41.2 | Immediate outbound | Highest urgency + impact + ability |
| Tier 2 | ≥ 36.5 | ABM nurture + SDR sequencing | Strong fit; sequence over 2–4 weeks |
| Tier 3 | ≥ 31.8 | Content-led nurture | Moderate fit; monitor for risk movement |
| Tier 4 | < 31.8 | Low-touch coverage | Low near-term priority |
Each tier maps to a different GTM motion. Tier 1 accounts get direct outbound from an AE with a custom narrative built around their specific risk drivers. Tier 2 gets ABM treatment with SDR sequencing. Tier 3 goes into content nurture and gets re-scored periodically. Tier 4 gets low-touch coverage until something changes.
The driver codes that ship with each account tell you why it scored where it did. An account in Tier 1 because of high China exposure and thin margins needs a completely different pitch from one scoring high because of single-supplier dependency and commodity volatility. The scoring prioritizes and shapes the message.
What This Project Demonstrates
Five things stood out building this:
-
ICP scoring for risk products needs to be structurally different from generic firmographic targeting. You have to model the specific risk posture. The company profile alone doesn’t get you there.
-
Composite scoring across need, impact, and ability produces more actionable targeting than any single dimension alone. A company can be highly exposed and unable to buy. A company can be financially fragile and operationally unexposed. The intersection is where you want to focus.
-
Correlated synthetic data is a credible foundation for GTM modeling. You don’t need real customer data to build and validate a targeting framework. You need economically realistic data with the right correlation structure.
-
Config-driven scoring earns its place in GTM use cases. A gradient-boosted model might squeeze out marginally better predictions on historical data, but it becomes a black box the moment a RevOps lead needs to adjust for a new tariff announcement or a sudden competitor exit. Config-driven systems, explicit weights with readable logic and adjustable thresholds, let the people closest to the market tune the model without engineering support. When speed and interpretability matter, that’s worth something.
-
Scoring without segmentation is incomplete. The value lives in the tier mapping, the GTM motion assignment, and the driver-specific messaging that follows from it.
What Comes Next
If this were a real engagement, the next steps would be:
- Calibrate weights against real campaign data. Run the first wave, measure response rates by tier, adjust.
- Add scenario modeling. What happens to the rankings if tariffs spike another 20%? If a major port shuts down? The framework supports this. You adjust the input distributions and re-score.
- Layer in intent and contact-level signals. ICP scoring tells you which accounts to target. Combining it with intent data tells you which ones are actively in-market. For how to build the signal reasoning layer on top of that, including how to distinguish idiosyncratic competitor signals from sector-wide noise, see the signal architecture post.
- Build score-movement triggers. An account that moves from Tier 3 to Tier 1 over two quarters is a different kind of signal from one that’s been Tier 1 the whole time.
If you’re selling into a category where the buyer’s pain is structural and variable, supply chain risk, cybersecurity, compliance, financial risk, your targeting system needs to model that structure. Revenue-sorted lists aren’t a strategy. Composite risk exposure, financial vulnerability, and buying readiness: that’s a strategy.
This project was built using Python with structured synthetic data generation, config-driven scoring, and automated visualization. The full PRD, scoring logic, correlation design, and output assets are available for review. Connect with me on LinkedIn.